
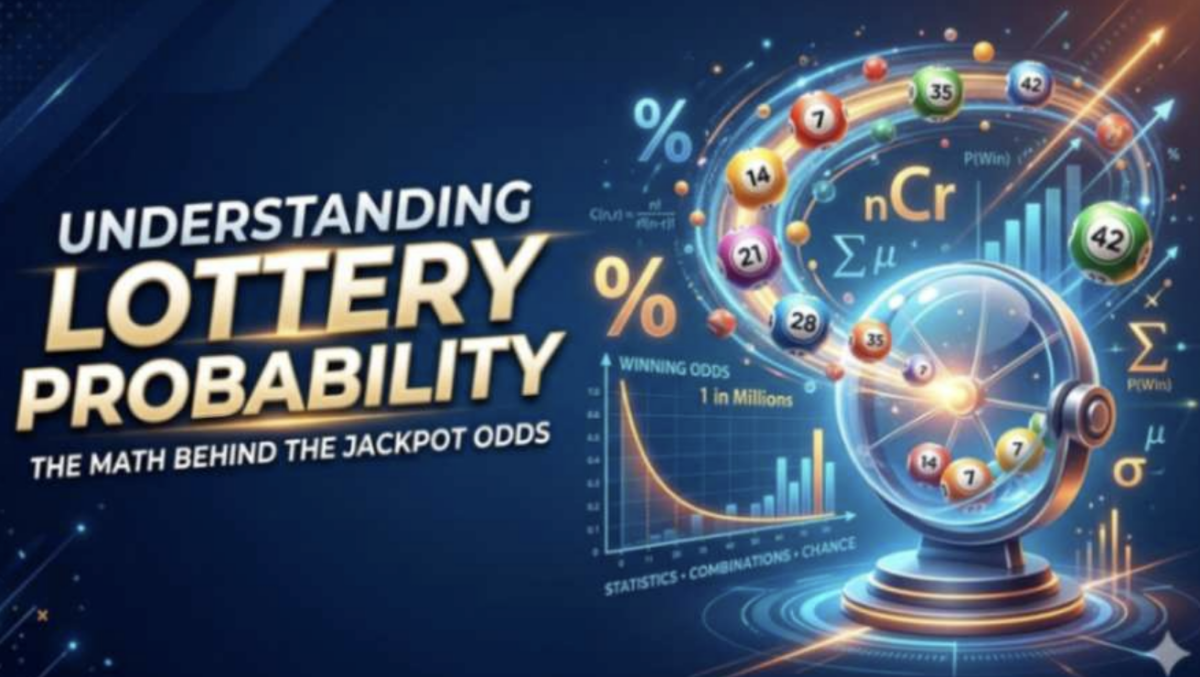
Most people who spin a slot or buy a lottery ticket have absolutely no idea what the actual probability of winning is. Not even close.
According to research published by gambling bebehaviour economists at institutions like the University of Gothenburg, the majority of casual players estimate jackpot odds based on gut feel — recent win stories, machine “temperature,” or just vibes. That gap between perceived and real probability is, frankly, enormous.
And it didn’t close overnight. Jackpot odds as a formalised concept barely existed before the mid-20th century. Early gambling — card rooms, horse tracks, informal lotteries — ran on loosely enforced house rules and word-of-mouth expectations.
Nobody was handing you a paytable. Nobody was publishing return-to-player percentages.
The house edge was real, it was enforced, but it was invisible to the player. That’s the legacy this whole industry still hasn’t fully shaken.
Where Jackpot Probability Actually Came From
By offering clear payout disclosures and independently verified random number generators, top-tier platforms like Spinshark Casino Uk provide modern players with complete probability transparency across every game in their catalog. The shift toward mathematical framing started — actually, let’s be precise here — with state-run lotteries and mechanised slot machines standardising prize structures.
Fixed prize tiers, fixed ticket counts, fixed odds. Suddenly you could print “1 in 14,000,000” on a scratch card and it meant something.
That specific “1 in X” format became the industry standard for communicating jackpot chances, and it stuck hard. It’s still the dominant format in 2026. Slot machines accelerated this.
Early mechanical reels had maybe 20 symbols per reel. Three reels.
The maths was simple enough that players could — in theory — calculate it themselves. Then digital video slots arrived and expanded symbol sets to 256 or more virtual stops per reel.
Same visual format. Completely different probability landscape.
The house edge ballooned silently while the interface stayed friendly. Research from gambling regulatory bodies across the EU documented this transition extensively, noting that player comprehension of odds actually dropped during the visual upgrade era despite the games becoming mathematically more transparent on paper.
How Transparency Regulations Rewired the Conversation
Regulatory pressure — particularly from the UK Gambling Commission, Malta Gaming Authority, and various Nordic regulatory bodies — forced a genuinely meaningful shift.
Operators had to publish RTP figures. Return-to-player percentages became a mandatory disclosure.
A game with 94% RTP returns, theoretically, £94 for every £100 wagered over its entire statistical lifetime. That’s the long run.
Not your session. Not tonight.
The long run. Here’s what that actually means in practice:
- A 94% RTP slot keeps 6% as the house edge — sounds small, feels devastating in a short session
- A progressive jackpot slot often runs a lower base RTP (sometimes 88–92%) because a portion of every bet feeds the jackpot pool
- Fixed jackpots offer more predictable odds but smaller maximum prizes
- Lottery formats typically have the worst long-run return of any jackpot format — sometimes below 50% RTP
Platforms like SpinShark Casino UK now display RTP figures directly on game information pages, which is a regulatory requirement in most licensed jurisdictions but wasn’t standard practice even a decade ago.
That shift from hidden to visible is genuinely significant for player awareness.
Progressive Jackpots and the Odds Paradox
Progressive jackpots break the normal odds-reward relationship in a specific and fascinating way. The jackpot grows.
The odds of hitting it don’t. That’s the core mechanic.
Every bet from every player feeds into a shared pool — the jackpot accumulates, sometimes reaching millions — but your individual probability of triggering the top prize remains fixed by the game’s RNG parameters regardless of the current pool size. So the “value” of the bet technically increases as the jackpot grows, but your actual chance doesn’t budge.
Some players call this the sweet spot — playing progressive slots when the jackpot is statistically “overdue” relative to its average trigger point. Mathematically speaking, that’s not how independent random events work.
Each spin is independent. But the psychological pull of a swollen jackpot counter is real and documented. Here’s a direct comparison of how different jackpot formats behave across key variables:
| Jackpot Type | Odds Structure | Typical RTP Range | Prize Behaviour |
| Fixed Jackpot | Set odds, unchanging prize | 94–97% (base game) | Same prize every trigger — predictable, a bit boring honestly |
| Progressive Jackpot | Set odds, growing prize pool | 88–93% (reduced base) | Grows until triggered — can hit seven figures on major networks |
| Lottery Format | 1 in millions — usually printed clearly | 45–55% (notoriously poor) | Fixed prize tiers, massive top prize, brutal long-run return |
| Daily Drop Jackpot | Must trigger before deadline | Varies widely | Guaranteed daily payout — odds shift as deadline approaches |
What Digital Platforms Changed About How Players Read Odds
Digital casino platforms — and this is where things got genuinely useful for informed players — started embedding real-time jackpot trackers, probability calculators, and paytable pop-ups directly into the game interface.
You no longer need to dig through a PDF regulatory filing to find the hit frequency of a bonus round. It’s one tap away.
At SpinShark Casino UK, game info panels typically show both RTP and jackpot contribution rate, which tells you exactly how much of your bet feeds the top prize versus the base game returns. The evolution of player tools across different eras looks roughly like this:
- Pre-1980s — odds were informal, mostly rumour and casino floor mythology
- 1980s–1990s — mechanical and early digital slots introduced fixed paytables but rarely explained probability in plain language
- 2000s — online casinos began publishing RTP figures but buried them in terms and conditions
- 2010s — regulatory pressure made RTP disclosure standard and visible at the game level
- Now — real-time jackpot data, mobile probability tools and cross-platform jackpot comparisons are routine
That’s four decades of drift from gut feel to mathematical literacy.
Slow. But real.
Why the Historical Framing Still Matters in Practice
The legacy of opaque odds — the era when “jackpot” just meant “big win, good luck” — still shapes how these games are marketed.
Rare-event framing, dramatic jackpot counters, the emotional weight of watching a progressive total climb toward €5,000,000 — that’s all inherited from decades of gambling design that deliberately obscured probability to amplify excitement. Understanding that heritage doesn’t make the games less fun.
It makes you a sharper player. Research from behavioural economists at Carnegie Mellon’s gambling cognition group has consistently shown that players who understand RTP and jackpot structure make more deliberate session decisions — not necessarily different ones, but more deliberate ones.